Rising Bubble Technique, Principle
The time required for an air bubble in a liquid to rise is directly proportional to its viscosity. Bubble rise rates vary with the inside diameters of viscosity tubes; therefore, the tubes must be precision matched to a tolerance that will keep bubble rise rate variations below the level of visual detection. Variations in viscosity readings or comparisons are visually imperceptible from viscosity tubes with inside diameter tolerances closer than ±0.025mm. Any variations in readings are attributed to differences in viscosities.
Viscosity is determined by either measuring the time an air bubble takes to pass between two specifically spaced marks on viscosity tubes, or by comparison to the bubble rate rise of calibrated viscosity standards. The accuracy of the method is therefore a function of precision matching of tube bores and identical score heights, which are measured from the center outside bottom.
Other factors, such as uniformity of temperature and verticality of tubes, influence timed bubble travel and controlled laboratory techniques are essential for precise results. For example, a variation in temperature of 0.1°C will cause a 1% variation in the timed bubble travel, and a one radius departure from tube verticality may introduce a 10% error in the timed bubble travel.
Procedure For Using Viscosity Tubes
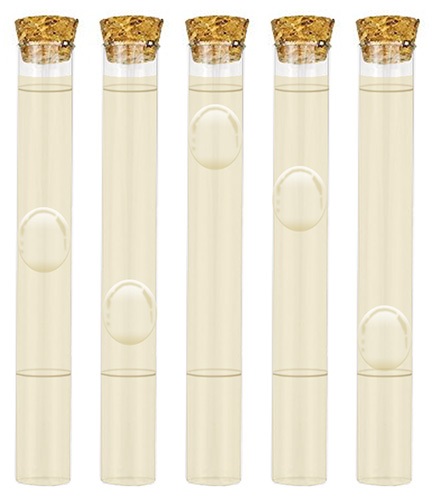
A viscosity tube is filled to the 100mm level score with the material to be tested. A cork is inserted to the 108mm score which provides and fixes a uniform air bubble. The sample, and standard if used, is placed in a suitable rack and immersed in a water bath until a uniform temperature of 25°C (77°F) is attained. If viscosity determinations are performed by referral to comparison samples of known viscosities or precisely calibrated standards, then they, too, should be at the same temperature as the samples. Viscosity is determined by one of two methods:
Comparison Method – The bubble rate rise of the samples is compared to samples of known viscosities or calibrated standards contained in tubes of the same dimensions. The rack containing the samples and standards is removed from the water bath, held vertically to stabilize the air bubbles and quickly inverted maintaining verticality. A comparison of air bubble speed of the samples to the standards permits estimation of viscosity; the faster the rate of bubble rise, the lower the viscosity. The user may prepare viscosity standards or employ Gardner Viscosity Standards.
Time-Method (ASTM D 1545) – TimeTest Tubes are required to determine viscosity by the Timed-Method. The length of time, in seconds, required for an air bubble to pass from the 27mm to 100mm score mark, a distance of 73mm, is approximately equal to the viscosity of the liquid in “Stoke” units; alternatively, viscosity may be expressed in “Bubble Seconds.” It is important to note that the position of the air bubble in relation to the 27mm score should be similar at the end of the test on the 100mm score.
Viscosity Tube Selection Guide
Viscosity Tubes are divided into three Classes as determined by precision sorting in accordance with bore size, number of score marks and contemplated method of use for bubble rise testing, Fig. 2. The numbers assigned refer to the bore size, which is expressed in mm.
Time-Test Viscosity Tubes, 10.65mm
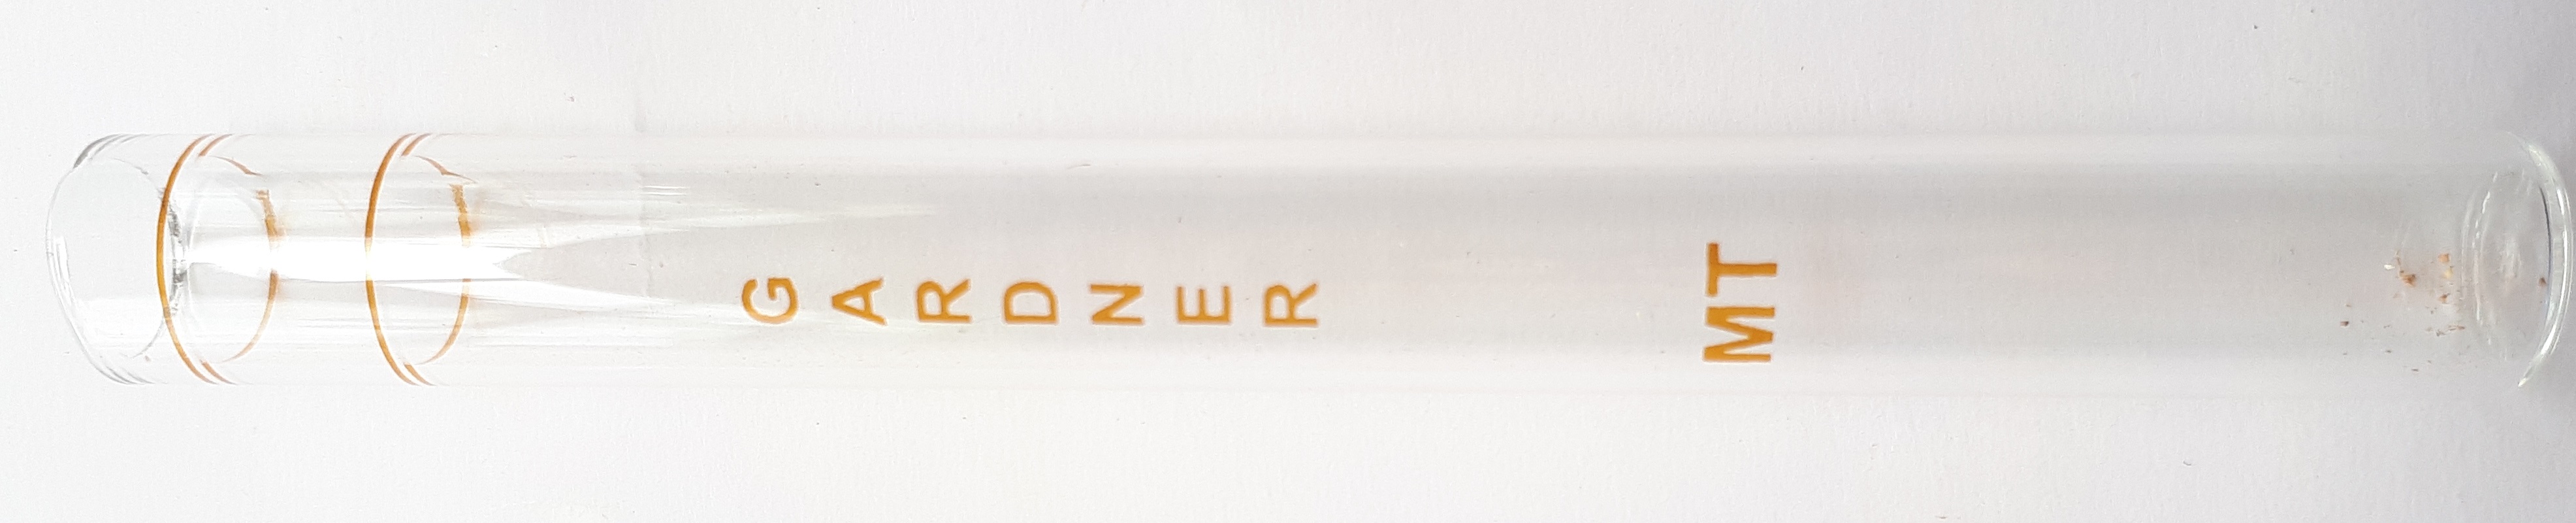
Time-Test Viscosity Tubes are frequently referred to as ASTM D-1545 Tubes, which originated from the adopted standard method of test for viscosity as described in ASTM D-1545 issued by the American Society for Testing and Materials. Time-Test Tubes are scored in three places: Fig. 3: 27mm, 100mm and 108mm. The score mark at 27mm is used for a 73mm timed travel. Time-Test Viscosity Tubes are also subjected to additional testing procedures to ascertain the 10.65mm bore which is very critical for precision measuring.
Class “G-10.65” and “V-10.75” Tubes
Class “G-10.65” and “V-10.75” Viscosity Tubes are used principally for direct comparisons to Gardner Viscosity Standards. Both Classes of tubes are inscribed at the 100mm and 108mm lengths, Fig. 4. For bubble rate rise comparisons to Gardner Viscosity Standards, the following equivalency chart is provided.
|

 The viscosity of many materials depends on shear rate and is classified accordingly, Fig 1b. Viscosity is expressed as Absolute, n, and Kinematic, v. Absolute viscosity is determined by measuring the shear force required to produce a given shear rate and is independent of the density of the liquid.


